

Exploratory Data Analysis - My Uber🚘 Ride History from unstructured data
This exercise was born out of curiosity. 🤔 I drive a lot, but I was curious to find out how much money I had spent, and what time of day had the most rides on Uber, since my first ride in December 2016.
However, according to Uber’s policy, only the past 30 days’ worth of ride history data can be provided.
Link to notebook on github ![]()
(1) Getting my Uber ride data or the trip history from Uber online.
-
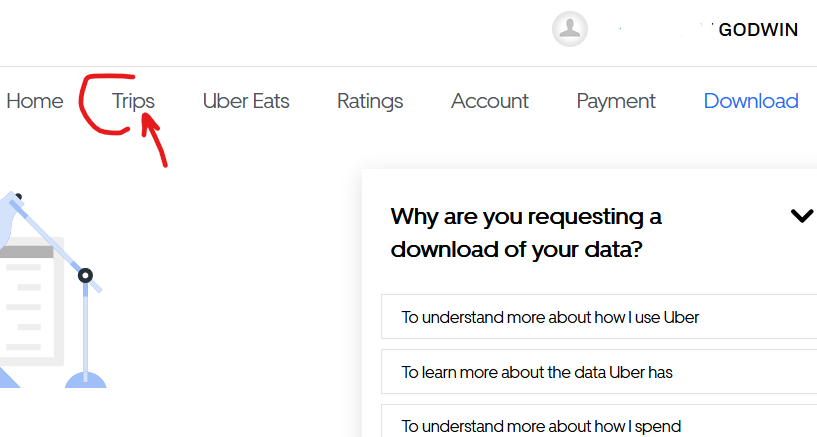
So I logged on to my uber account online
-
After login, click the Trips tab.
(2) Copying the data and pasting into excel
-
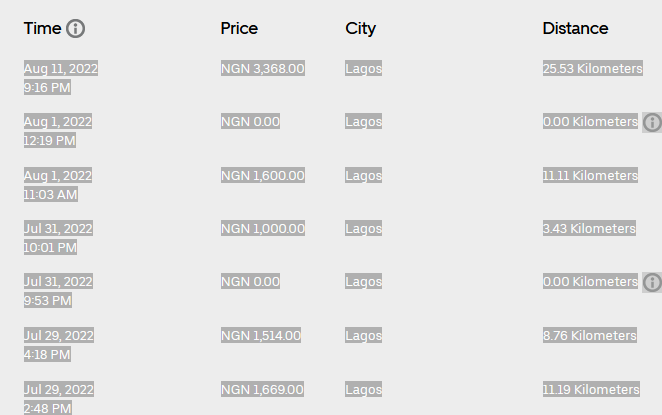
Then select to highlight your report from top to botton.
-
Copy this and paste in an excel workbook. Save as csv file format.
(3) Importing with pandas
-
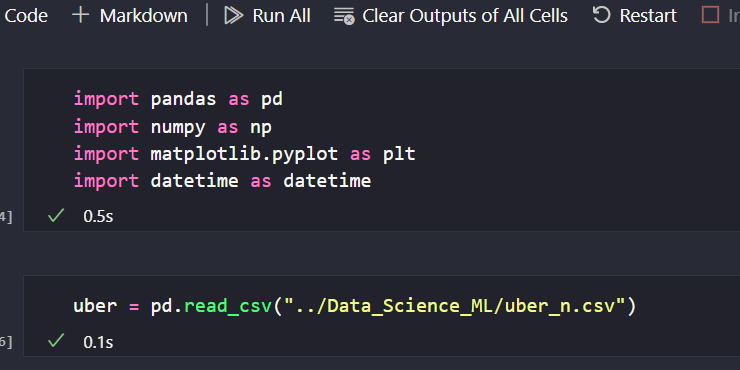
Import with pandas into your IDE or prefered code editor such as Jupyter notebook or Visual Studio code pandas. Here I am using VSC.
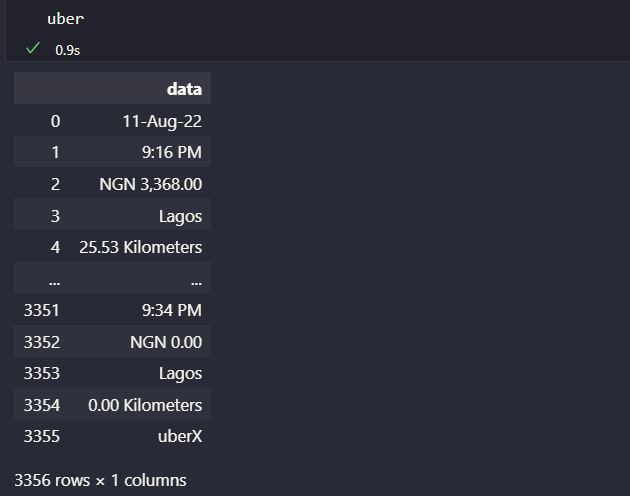
You will get a dataframe that has a single column, unstructured data lumped together.
(4) Preprocessing data to get the needed features.
-
You will have to apply all forms of preprocessing methods, looping through the column to extract the required features.
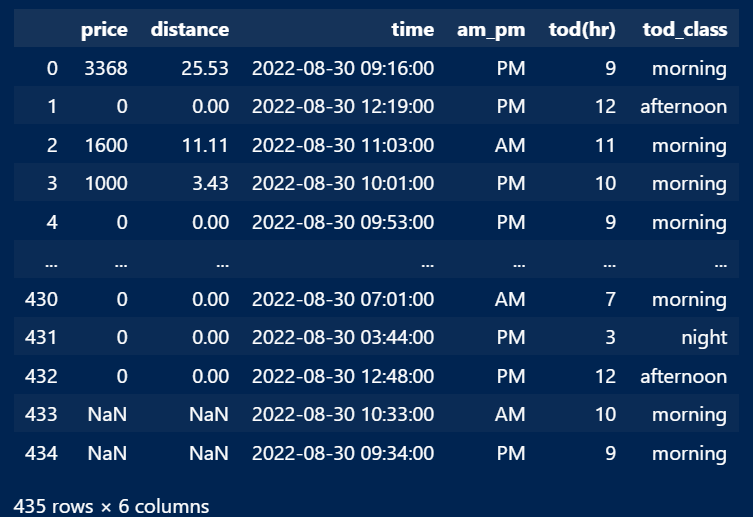
This was my final dataframe. The 0.00 km and NGN0.00 (Nigerian Naira) indicates cancelled trips.
(5) Findings from data exploration and analysis
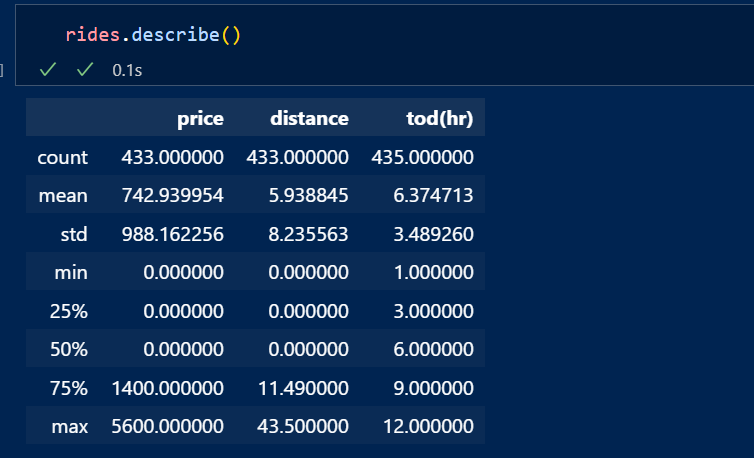
- I have booked a total of 433 trips on Uber mobile app (Dec 16, 2016 - August 30 ,2022)
- About 208 completed trips and 227 cancelled :-)
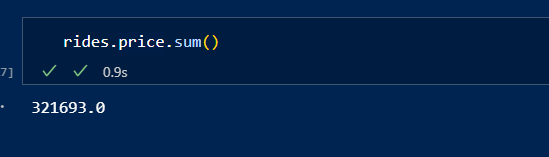
Spent N322,000 Nigerian Naira so far == USD 631 , by todays exhange rate
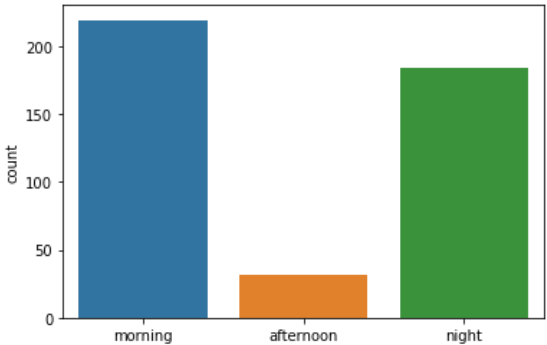
I have done more trips diring the morning and night
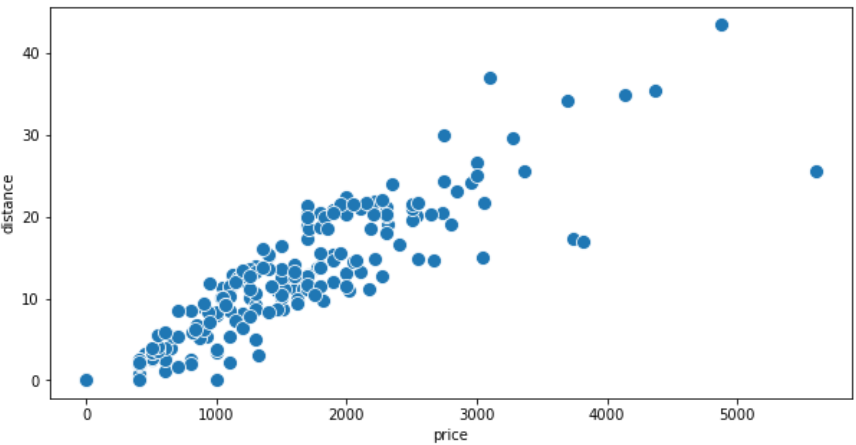
Price and distance are positively(high) correlated
(6) Short video illustrating the steps
This short video will give you a glimpse on the preprocessing steps to final dataframe